If you’re reading this, then I’m guessing you have one of those mechanical utility meters in your basement or garage. You know the type, those meters with rotating digits, just like the one in the cover image. In this post, I’ll walk you through the steps to convert any ‘mechanical-digit’ meter into a ‘smart’ one. How smart? As smart as you want them to be! So let’s dive in.
Step 1: Getting the readings.
The first step is making sure we can get readings in a digital format for use in future programming scripts. We’re going to use Google Cloud Vision API for this. After that, we’ll completely automate our input-to-output process, so we can get a constant stream of values which we can use to react upon in any way we see fit.
Before writing any code, we’ll need to set up our Google Cloud account and configure some settings to use the Vision API.
Specifically, we’ll have to
- Create a new project (I’ve called mine
water-vision) - Enable the Google Cloud Vision API in your project, under “Api & Services”.
- Create a Service Account and download it’s JSON key, so you’ll be able to communicate with Google Vision from your local system.
- Install the
gcloudcommand line utilities if you haven’t already. For Mac users, you can usebrew install gcloud.
After that, using Google’s Vision Api only requires a very little amount of code to work. Here is a TypeScript example:
const vision = require("@google-cloud/vision");
const options = {
  keyFilename: "/path/to/key.json",
  projectId: "water-vision-id",
};
const client = new vision.ImageAnnotatorClient(options);

const textDetection = async (filePath: string): Promise<string> => {
  const [result] = await client.documentTextDetection(filePath);
  return result.fullTextAnnotation;
};

const main = async () => {
  const filePath = "./data/image_of_meter.jpg";
  const googleText = await textDetection(filePath);
  console.log(googleText);
};

main();
The file image_of_meter.jpg represents your own picture of your analog meter. As an example, the picture below, taken with a smartphone, is the one I use to run this script (identifying info removed).
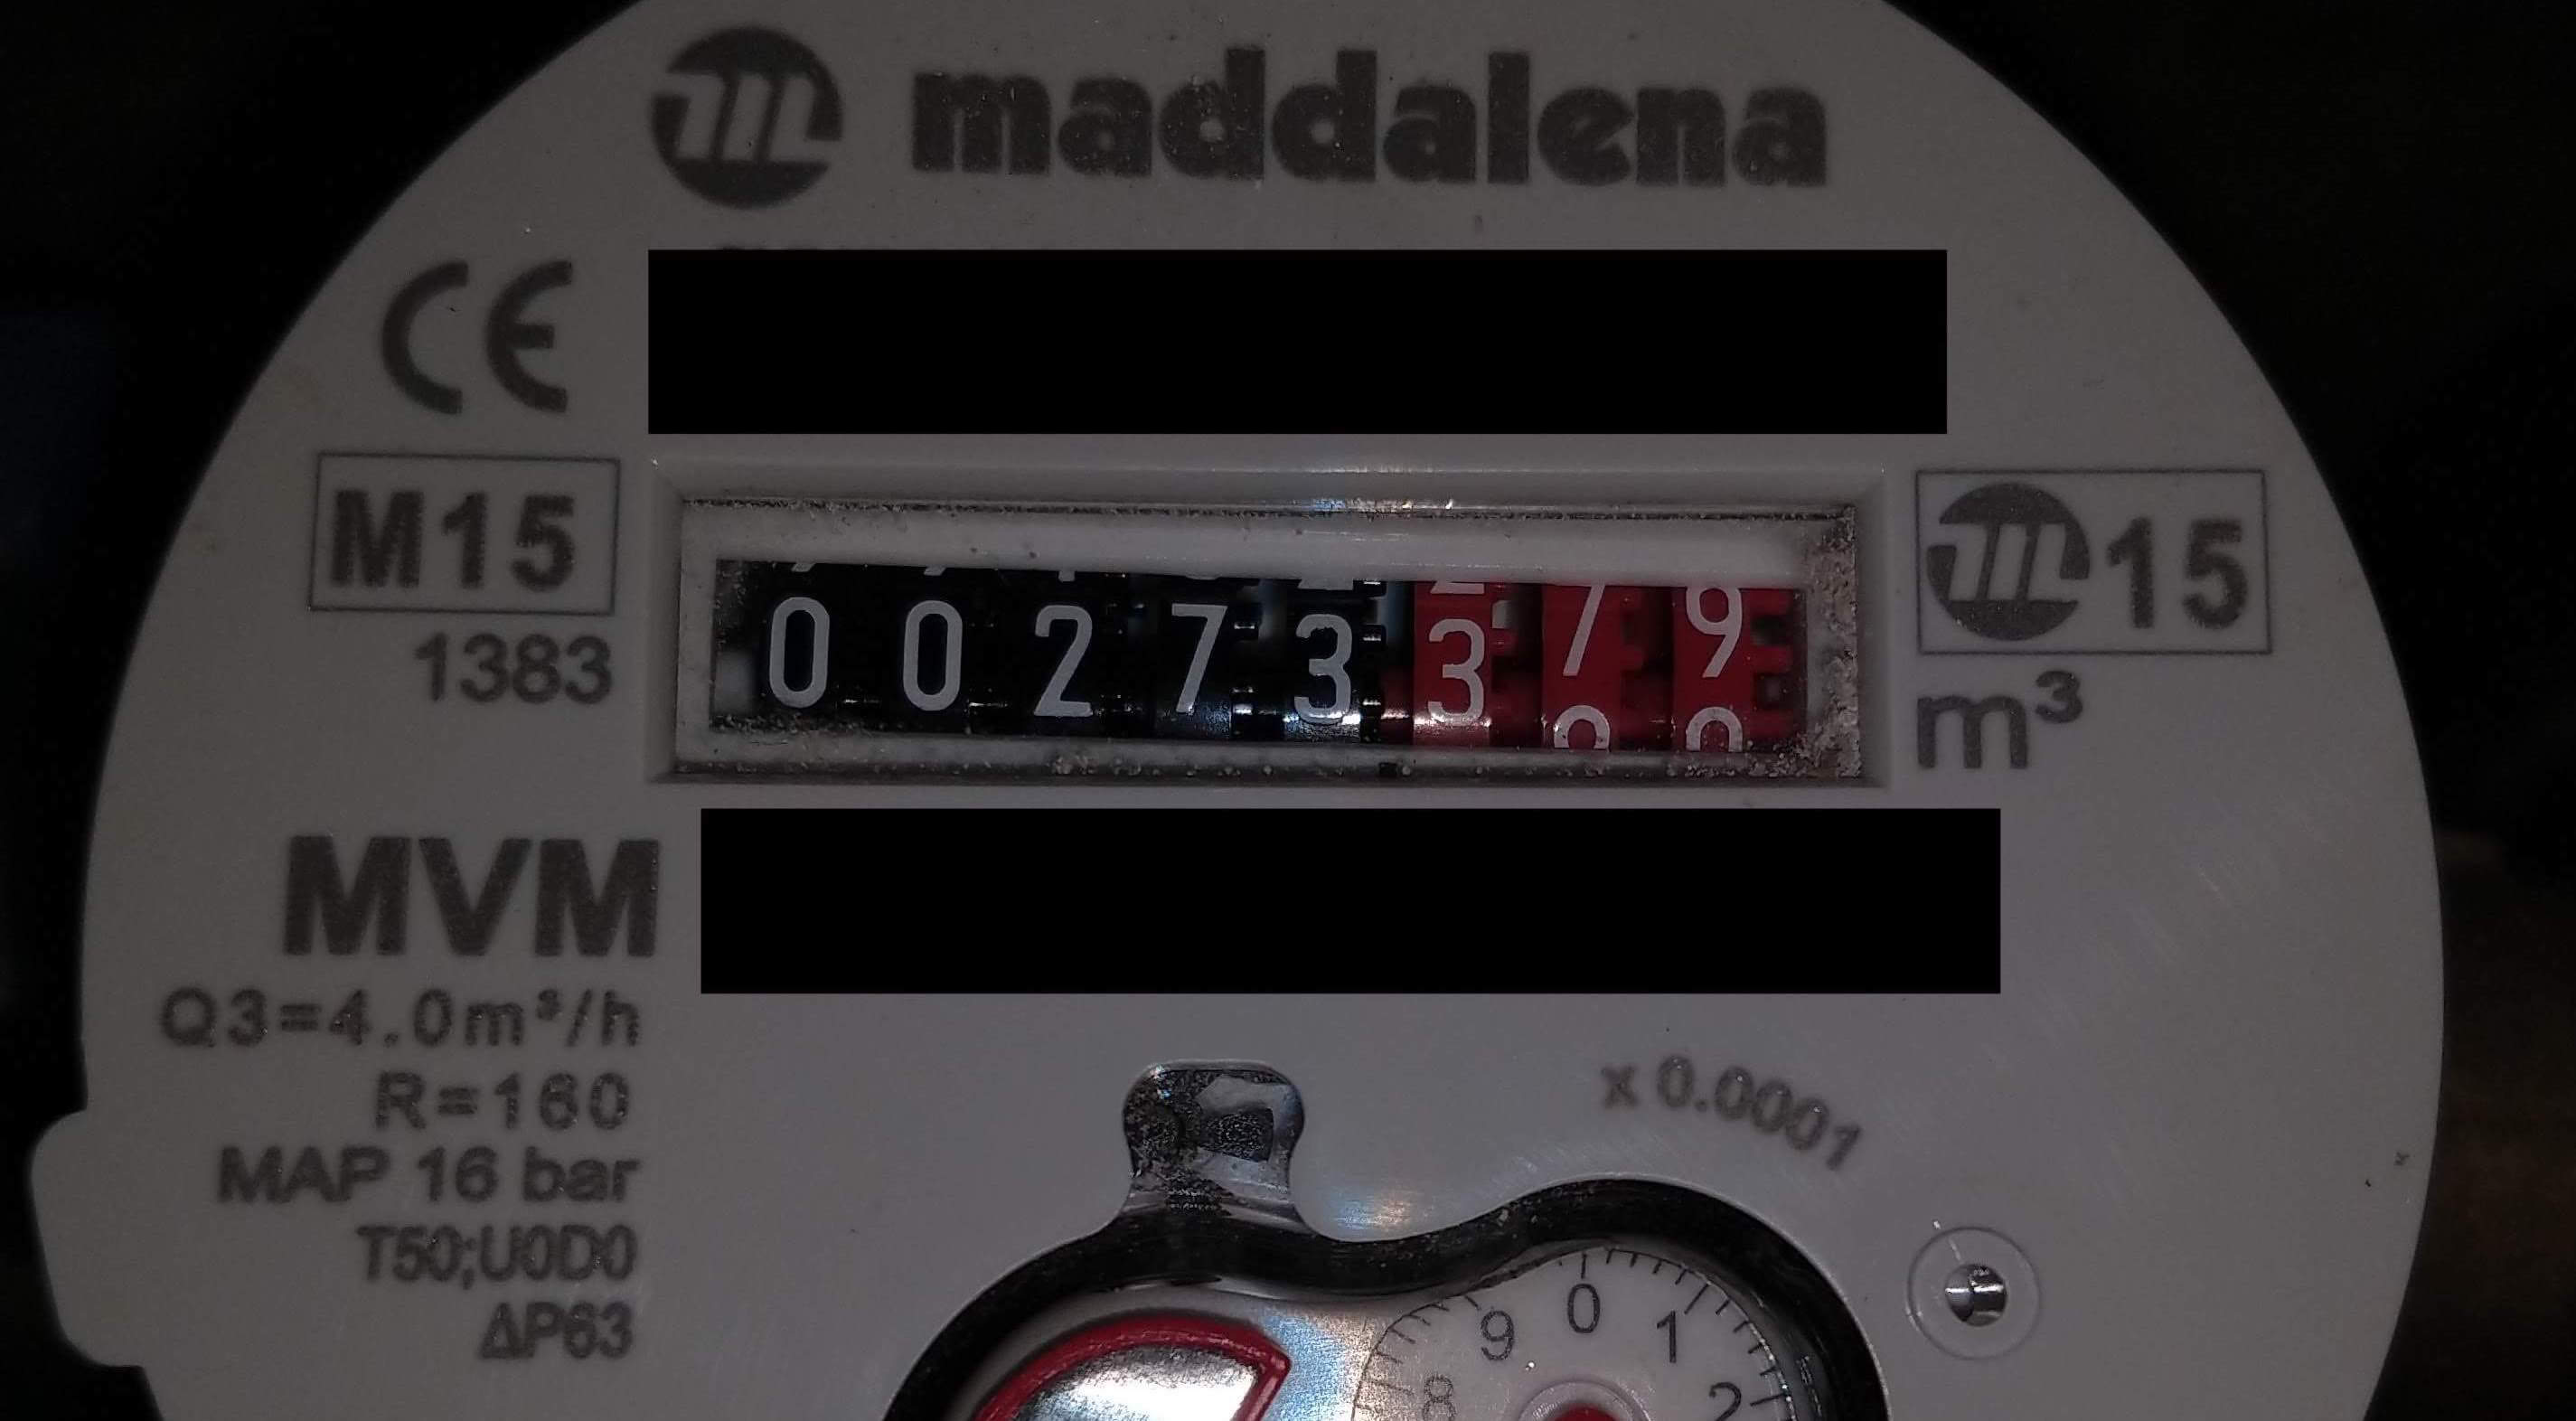
Running the script will upload your photo to vision.googleapis.com, where Google Vision will process the photo and return the results afterwards.
The results of running the script in the terminal, with the photo above as input, returns something like:
TIL maddalena
CE ********
M15
1383 0.0.2.733
MVM ********
TIL 15
m
0.0001
Q3=4.0m/h
R=160
MAP 16 bar
T50;UODO
AP83
27
6 5
There are a couple of things to note here:
-
The response effectively puts newline characters (
\n) between the parts he deems as separate sections. This will be helpful for further parsing and extracting our value we are interested in. -
Depending on the viewing angle of the camera and the lighting, these results differ from time to time, resulting in different line combinations which makes it a bit more difficult to parse (read on below).
-
The mechanic meter’s digits in this example have 2 different types of rotating digits. The black ones in the picture rotate so that the digit is always visible. The red ones however rotate by fractions of their value, so the number is not always clearly visible. Because not all of these ‘red’ digits are clearly visible from this meter, Google vision fails to recognize the last digits (
7and9in this case). We therefor will only be focusing on the ‘black’ digits in this post to keep things simple.
Step 2: Parsing the raw data
This step will be highly customized to your own situation. As an example, I’ve put my code on github, so can take a look at the parsing logic specific to my case.
Running the above output from Google Vision should give us the correct result of 273 (m³).
Step 3: Transferring all logic to the cloud
Because we already have to send data to the cloud (the photo must be sent to Google for parsing), we are going to put ‘the brains’ of our smart meter in the cloud as well. The following picture sketches the layout.
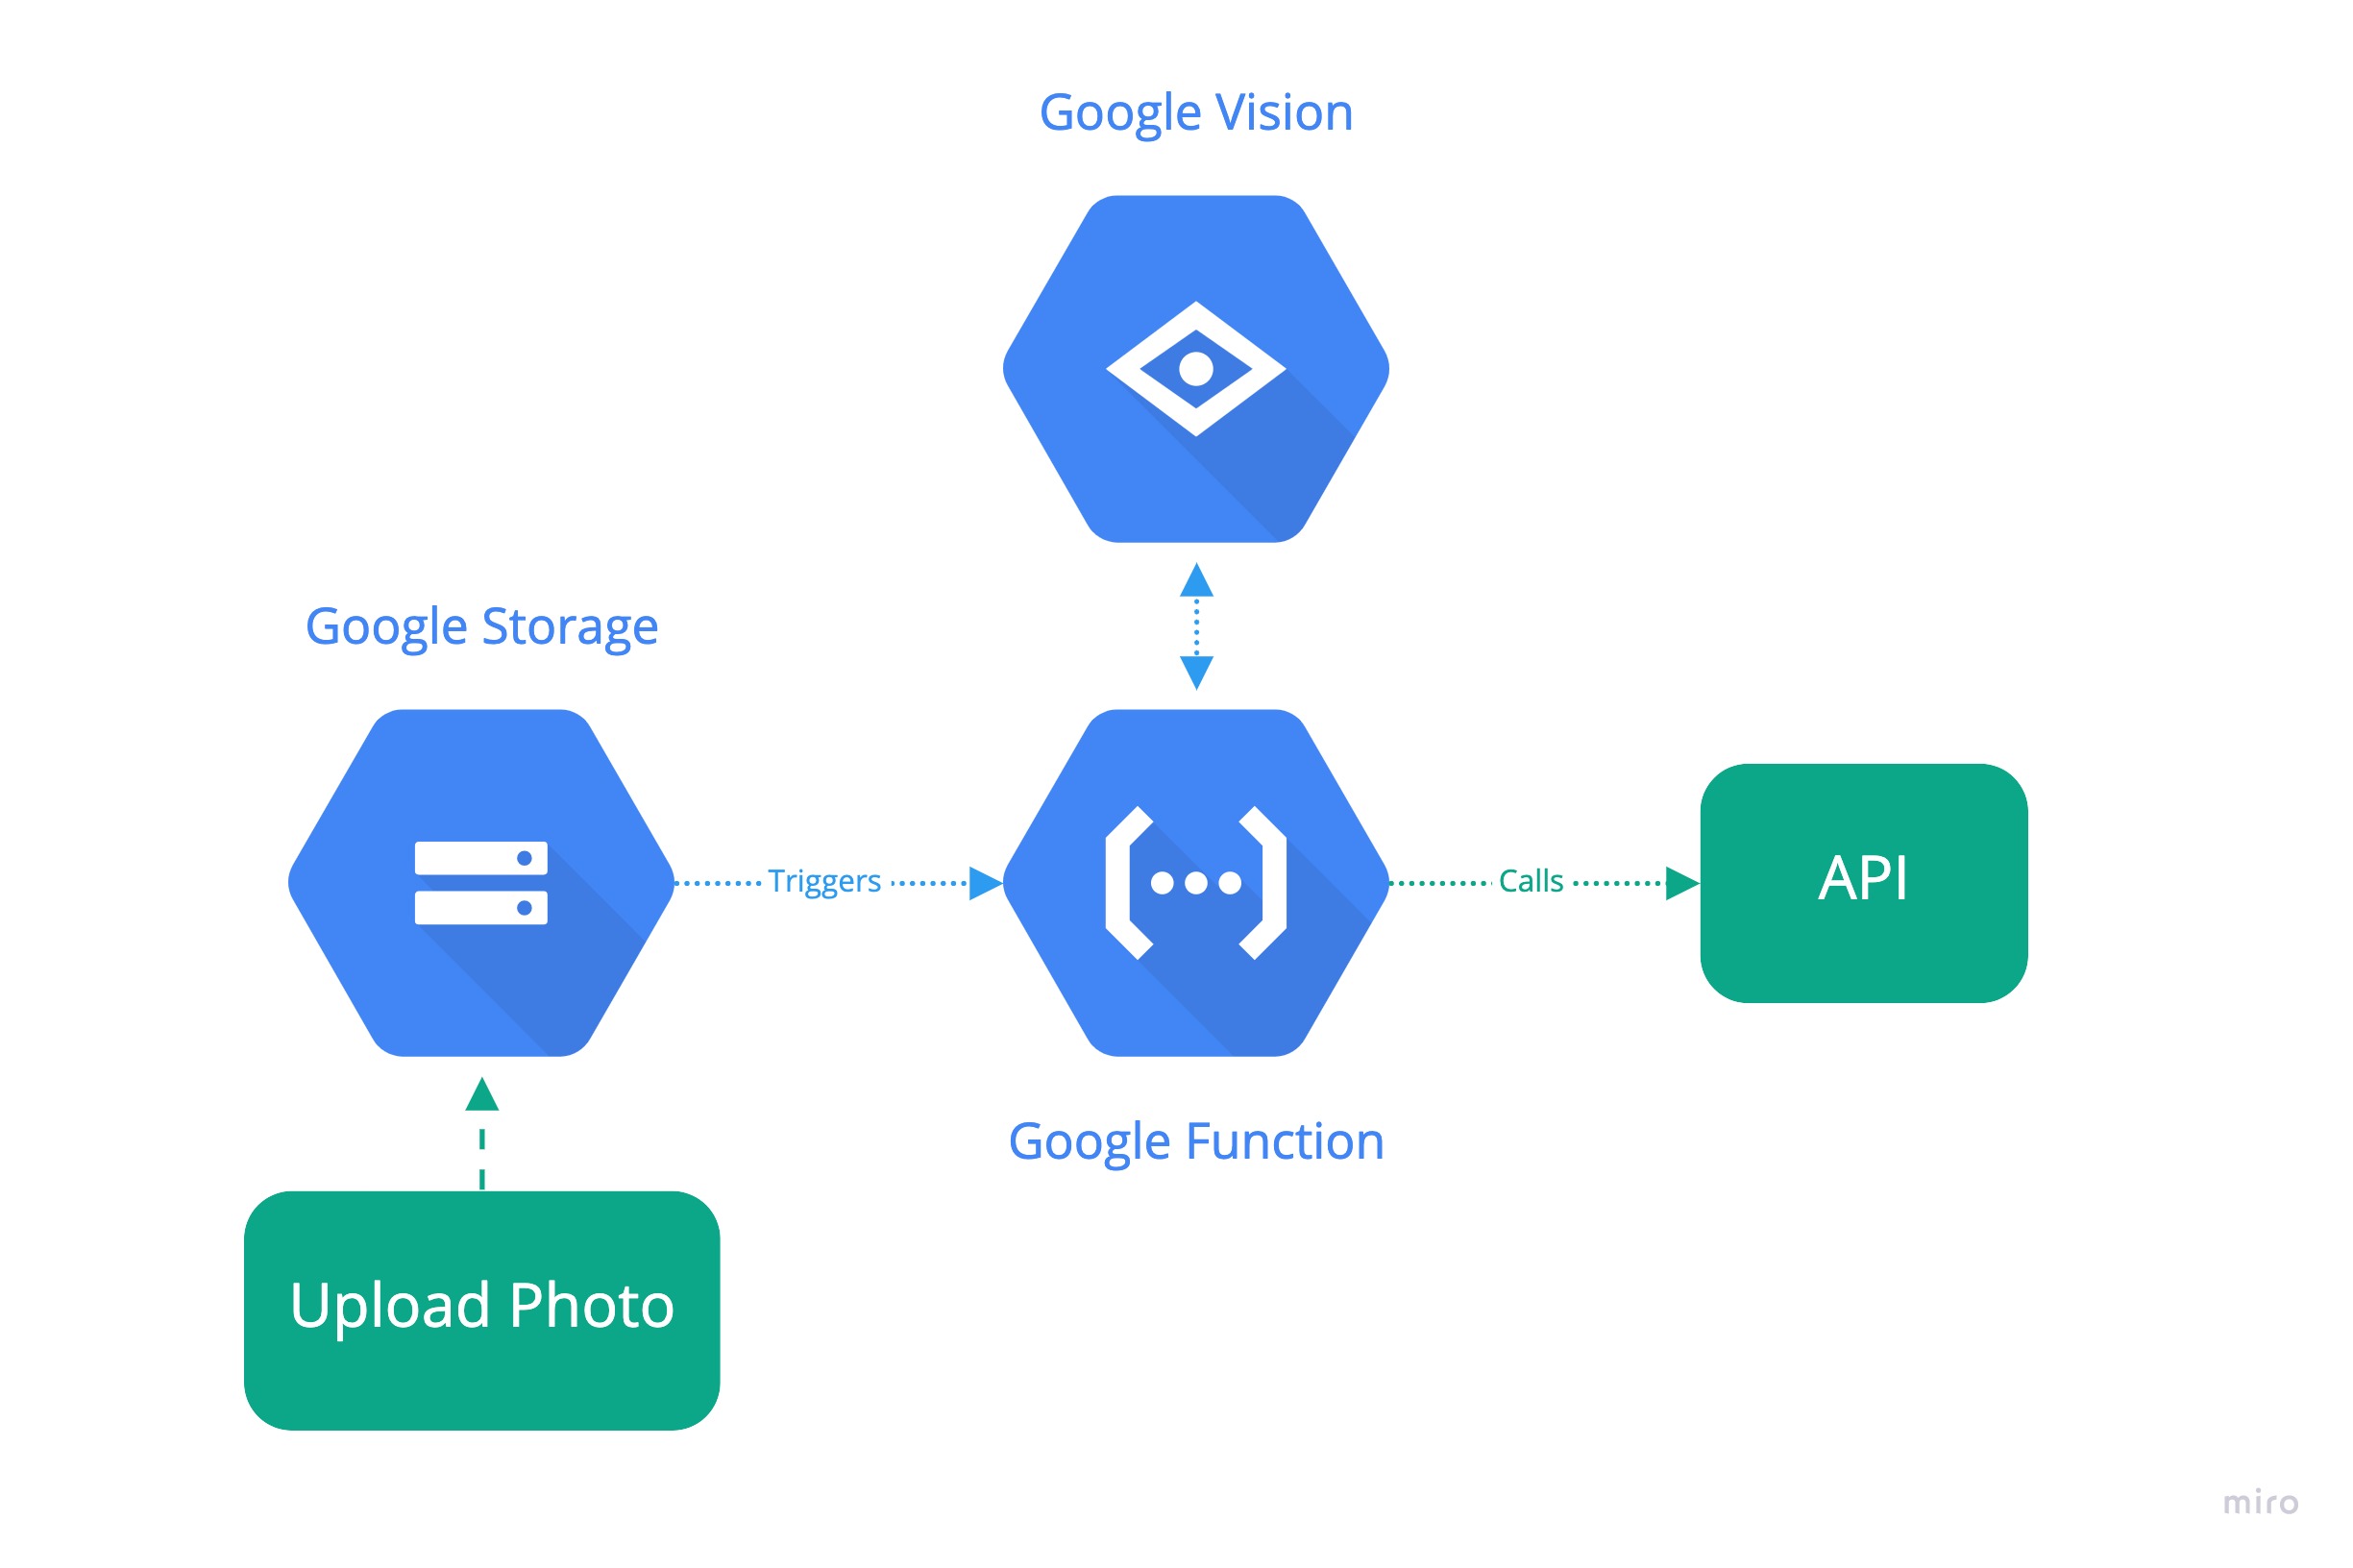
Every time we upload a photo to a Google Storage bucket (the equivalent of AWS S3 buckets), we trigger a Google Function, which executes all of our logic. In this case:
- Give the photo to Google Vision
- Parse the raw data from Google Vision to the actual readout (in m³)
- Pass this value to a downstream API which aggregates these values
The logic you want to execute after parsing the value can be anything. With cloud services like Google IoT or AWS Iot, we could send commands to microcontrollers that operates our utility network, which would make sense in the case of ‘smart meters’. In my case, I’ve chosen to keep things simple, and send the value to an API of EnergyId, a free-to-use web application meant for giving you insights in your water, gas and electricity usage. They offer multiple integrations including webhooks to send your data to.
A complete code example of this setup can be found in this repository. Check the readme.md for getting started with the code.
Step 4: Setting up a Raspberry Pi
We’re going to use a Raspberry Pi to automate a couple of things. Most importantly, the Pi is going to be responsible for taking pictures of our mechanical meter and push them to the Google Storage bucket, where the Cloud function will take over and perform all subsequent logic.
We’ll first need to install Raspberry Pi OS (previously called Raspbian) on our Pi, and make sure we can connect via ssh to the Pi. The simplest way to enable ssh is by placing an empty ssh file in the boot partition on the SD card.
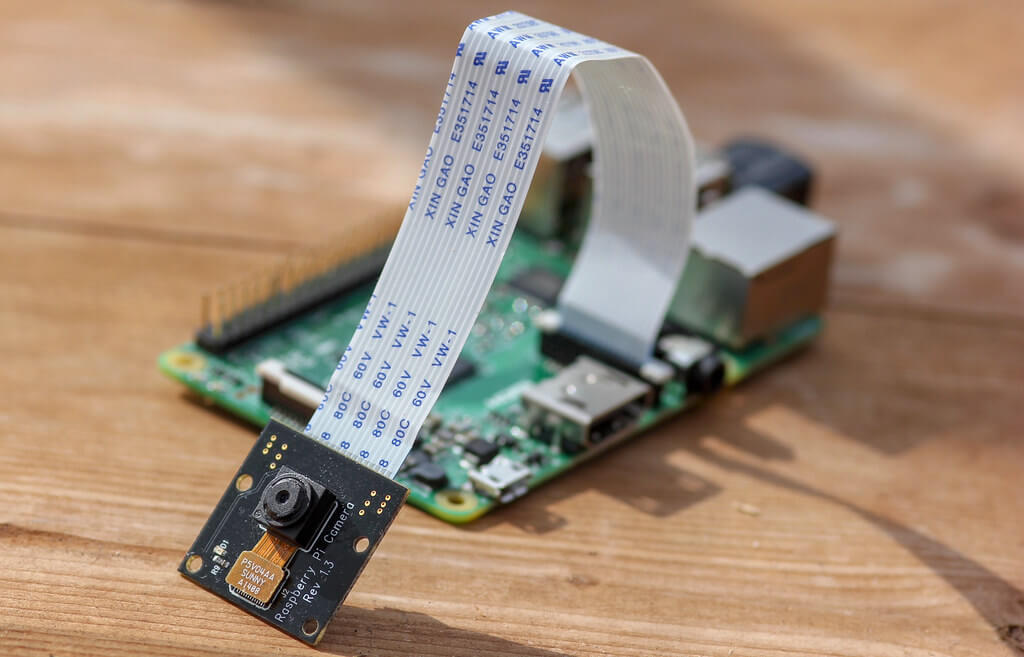
Camera module
We’re going to need a camera module for the Pi. You don’t need anything fancy. A basic one like this one will suffice. Once installed, ssh to the pi, and run sudo raspi-config. Here we can enable the camera module. We can test if everything works by running raspistill -o test.jpg. This will take a picture and store it under ~/Pictures folder. Check out a complete setup guide about the pi-camera here.
Node-RED
Now that we got the hardware setup done, we’ll need a way to control our hardware in structured manner. Instead of writing scripting code, we are going to use a tool called Node-RED. We can install it on the pi itself with a couple of bash commands. Check if everything works by opening a browser on your system that points to http://[IP_OF_YOUR_PI]:1880.
Node-Red makes it extremely easy to extends its functionality through the use of the npm package ecosystem. We’ll going to install some additional packages: The node-red pi-camera package, and the node-red google-cloud package. We can install these from inside Node-RED itself, by going to the top menu and selecting Manage Palette > Install Then search for node-red-contrib-google-cloud and node-red-contrib-camerapi and click install.
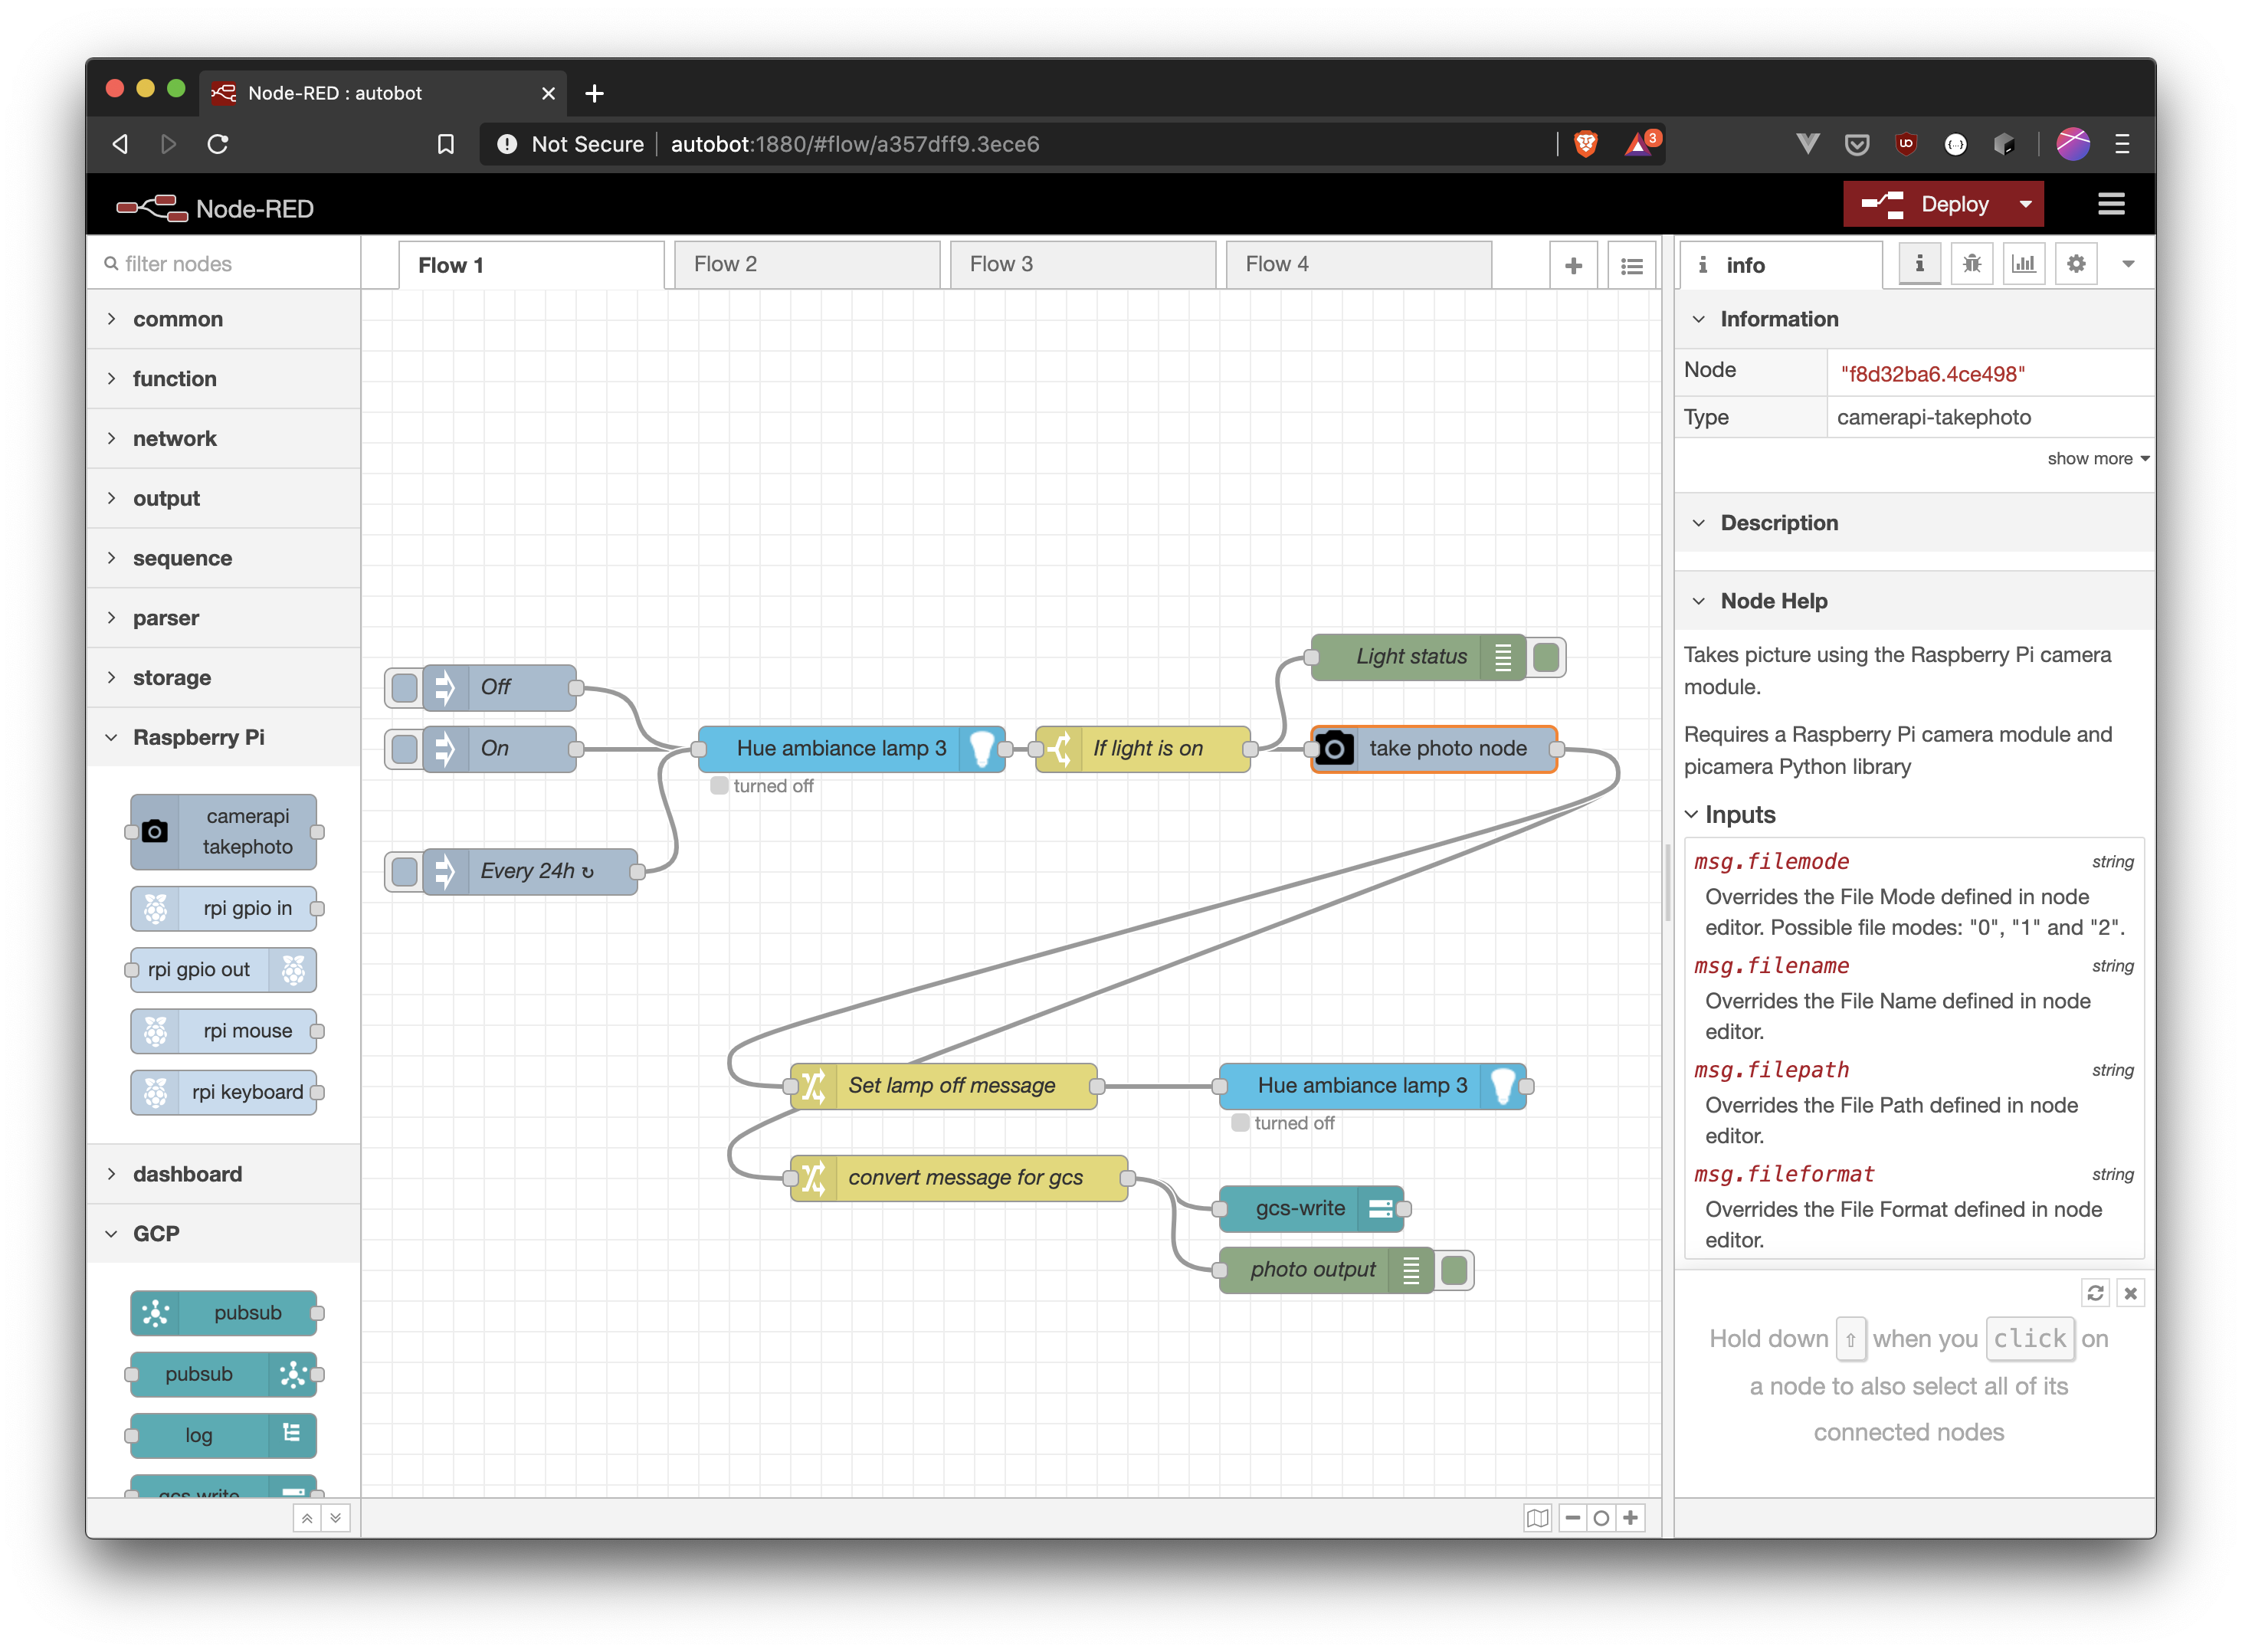
The installation of these packages will give us some more ‘nodes’ in our editor to construct our process flows. In the screenshot below, you’ll see the flow I’m using for this process. With this flow, I’m able to trigger the flow both manually (by pressing the button next to On), and automatically (by defining a repeating timer node). The flow ends with gcs-write which will upload the photo taken to the relevant Google storage bucket.
Step 5: Recalibrating
After installing the pi-camera above my water-meter, I noticed the photo results where not clear enough for Google Vision to read the values from. That’s because the lighting for the camera was insufficient. What was needed was some kind of ‘flash’ when taking the picture. Because there is no flash on a standard pi-camera, I resorted in using a Philips Hue light bulb I had still lying around. These bulbs can be controlled via wifi, which makes them perfect candidates as a kind of ‘flash’. Furthermore, Node-RED makes it extremely easy to incorporate them in your flows. (“There is package for that!” node-red-contrib-huemagic). If you take another look at the Node-RED screenshot above, you see how this is included in the complete flow:
- Turn on the Hue light
- When we get a signal that the Hue light is on, take a picture
- Upload the picture data to Google Storage
- Turn off the Hue light again
- Repeat every 24 hours!
As an example, I’ve included this Node-RED flow configuration in the same repository as above.
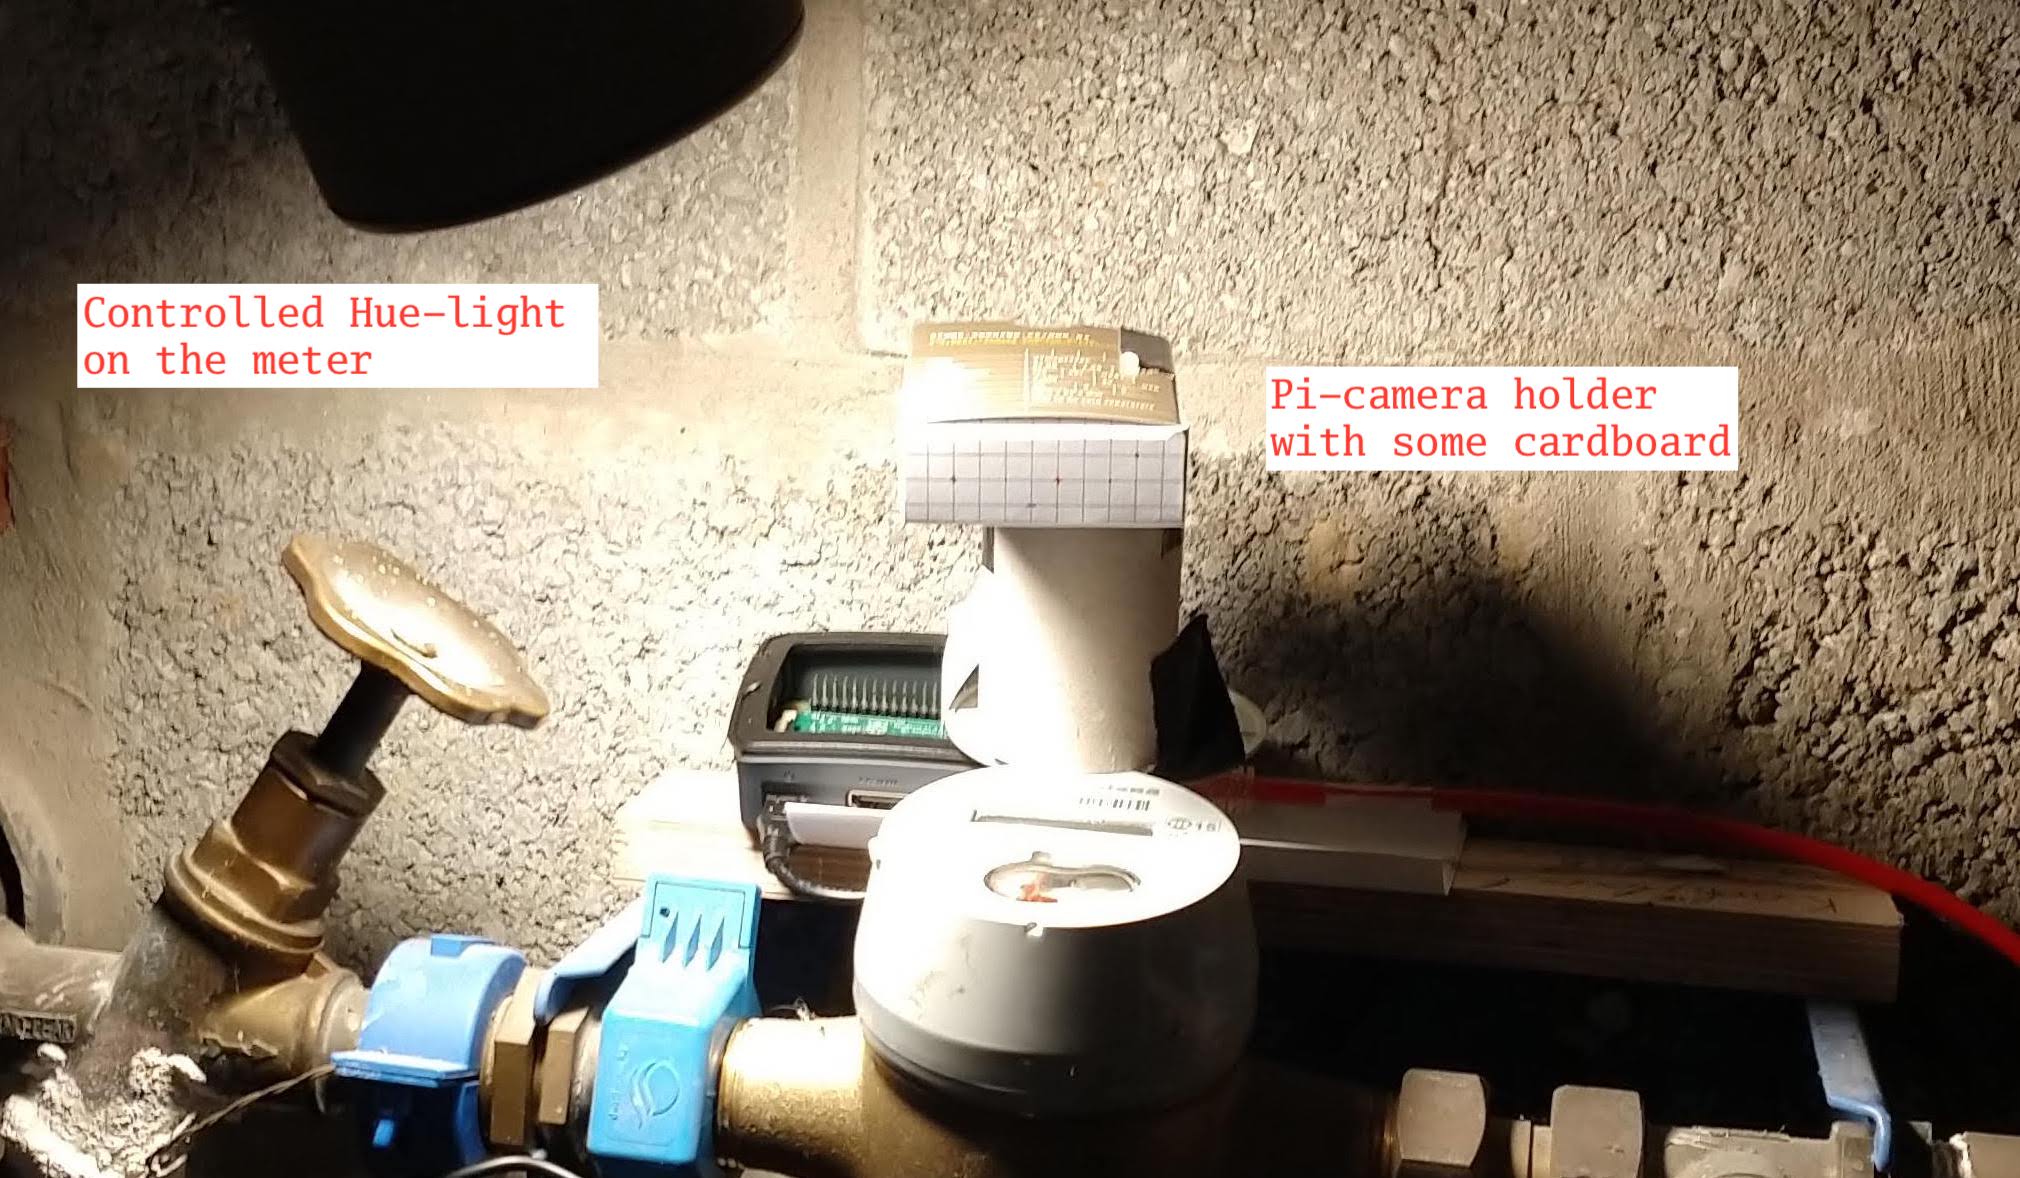
Here is a picture of my setup in the basement that’s controlled with Node-RED.
End-to-End
Below, you can find a video of the complete end-to-end result.
This marks the end of the DIY guide. If you made it this far in your project, congratulations! I hope this post inspired you to dig further in the possibilities of these technologies. Best of luck!
Last modified on 2020-06-06